Electronic Mail Processing Queue
The following charts represent the Electronic Mail queue.
The statistics were last updated Tuesday, 7 February 2006 at 13:51
`Daily' Graph (5 Minute Average)
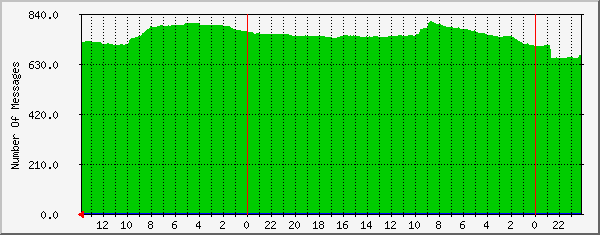
| Max Queue: | 808.0 msgs (0.8%) | Average Queue: | 748.0 msgs (0.7%) | Current Queue: | 721.0 msgs (0.7%) |
`Weekly' Graph (30 Minute Average)
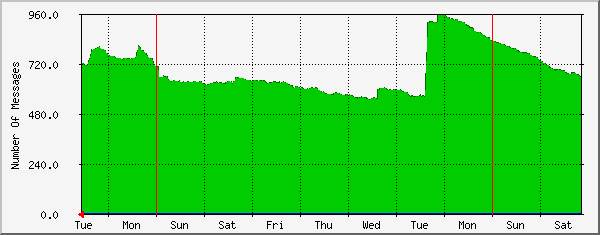
| Max Queue: | 959.0 msgs (1.0%) | Average Queue: | 692.0 msgs (0.7%) | Current Queue: | 724.0 msgs (0.7%) |
`Monthly' Graph (2 Hour Average)
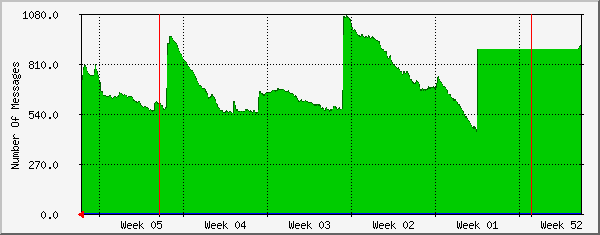
| Max Queue: | 1070.0 msgs (1.1%) | Average Queue: | 725.0 msgs (0.7%) | Current Queue: | 716.0 msgs (0.7%) |
`Yearly' Graph (1 Day Average)
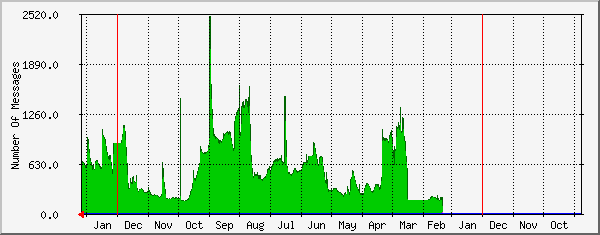
| Max Queue: | 2487.0 msgs (2.5%) | Average Queue: | 545.0 msgs (0.5%) | Current Queue: | 735.0 msgs (0.7%) |
| GREEN ### | Incoming Traffic in Bytes per Second |
| DARK GREEN### | Maximal 5 Minute Incoming Traffic |
| 2.11.1 | Tobias Oetiker <oetiker@ee.ethz.ch> and Dave Rand <dlr@bungi.com> |