|
|
CPU Usage
The statistics were last updated Tuesday, 7 February 2006 at 13:51
`Daily' Graph (5 Minute Average)
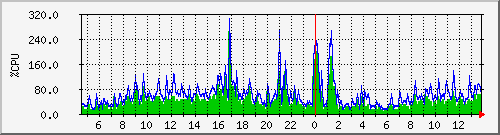
| Max user: |
264.0 %CPU
|
|
Average user: |
40.0 %CPU
|
|
Current user: |
40.0 %CPU
|
| Max total: |
304.0 %CPU
|
|
Average total: |
64.0 %CPU
|
|
Current total: |
56.0 %CPU
|
`Weekly' Graph (30 Minute Average)
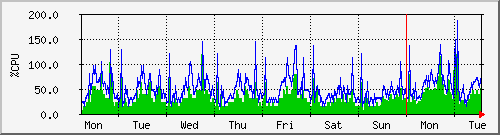
| Max user: |
120.0 %CPU
|
|
Average user: |
32.0 %CPU
|
|
Current user: |
48.0 %CPU
|
| Max total: |
184.0 %CPU
|
|
Average total: |
48.0 %CPU
|
|
Current total: |
72.0 %CPU
|
`Monthly' Graph (2 Hour Average)
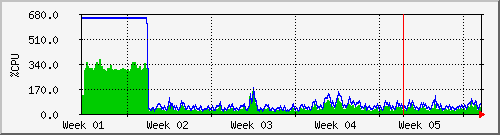
| Max user: |
368.0 %CPU
|
|
Average user: |
72.0 %CPU
|
|
Current user: |
40.0 %CPU
|
| Max total: |
648.0 %CPU
|
|
Average total: |
144.0 %CPU
|
|
Current total: |
64.0 %CPU
|
`Yearly' Graph (1 Day Average)
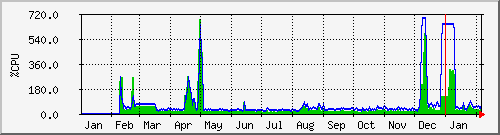
| Max user: |
680.0 %CPU
|
|
Average user: |
48.0 %CPU
|
|
Current user: |
40.0 %CPU
|
| Max total: |
688.0 %CPU
|
|
Average total: |
80.0 %CPU
|
|
Current total: |
56.0 %CPU
|
|
GREEN ### |
Time spent in user mode |
|
BLUE ### |
Time spent in user mode + time spent in system mode |
|